Savery Slice Survey


Power bi dashboard
About this project
Follow the link for dataset and interactive dashboard:
https://github.com/SakshiYadav13/Savery-Slice-Survey?tab=readme-ov-file
PROBLEM STATEMENT
KPI’s REQUIREMENT
We need to analyze key indicators for our pizza sales data to gain insights into our business performance. Specifically, we want to calculate the following metrics:
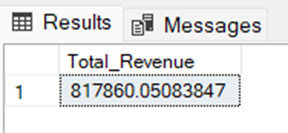
Total Revenue: The sum of the total price of all pizza orders.
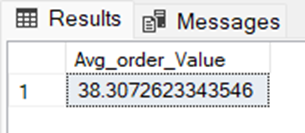
Average Order Value: The average amount spent per order, calculated by dividing the total revenue by the total number of orders.
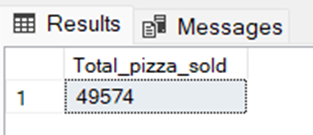
Total Pizzas Sold: The sum of the quantities of all pizzas sold.
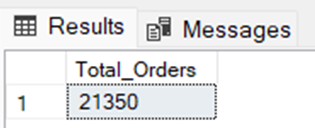
Total Orders: The total number of orders placed.
Average Pizzas Per Order: The average number of pizzas sold per order, calculated by dividing the total number of pizzas sold by the total number of orders.
CHARTS REQUIREMENT
We would like to visualize various aspects of our pizza sales data to gain insights and understand key trends. We have identified the following requirements for creating charts:
Daily Trend for Total Orders: Visualize the ebb and flow of daily order volumes over a specific time period with a dynamic bar chart. Uncover patterns and fluctuations to optimize daily operations.
Monthly Trend for Total Orders: Dive into the nuances of hourly order trends throughout the day using an insightful line chart. Identify peak hours and high-activity periods for strategic planning.
Percentage of Sales by Pizza Category: Delve into the pizza world with a colorful pie chart, showcasing the distribution of sales across different categories. Gain valuable insights into the popularity and contribution of each category.
Percentage of Sales by Pizza Size: Slice through customer preferences with a pie chart highlighting the percentage of sales attributed to different pizza sizes. Uncover the impact of size preferences on overall sales.
Total Pizzas Sold by Pizza Category: Compare the performance of pizza categories with a visually engaging funnel chart. Understand the sales dynamics and make informed decisions for each category.
Top 5 Best Sellers: Revenue, Quantity, and Orders: Spotlight the stars of our menu with a comprehensive bar chart showcasing the top 5 best-selling pizzas based on Revenue, Total Quantity, and Total Orders. Identify customer favorites and optimize offerings.
Bottom 5 Best Sellers: Revenue, Quantity, and Orders: Pinpoint areas for improvement with a revealing bar chart highlighting the bottom 5 worst-selling pizzas based on Revenue, Total Quantity, and Total Orders. Streamline the menu and enhance customer satisfaction.
SQL QUERIES
KPI’s
1. Total Revenue
SELECT SUM(TOTAL_PRICE) FROM pizza_sales;
2. Average Order Value
SELECT (SUM(TOTAL_PRICE) / COUNT(DISTINCT ORDER_ID)) AS AVG_ORDER_VALUE FROM pizza_sales;
3. Total Pizzas Sold
SELECT SUM(QUANTITY) AS TOTAL_PIZZAS_SOLD FROM pizza_sales;
4. Total Orders
SELECT COUNT(DISTINCT ORDER_ID) AS TOTAL_ORDERS FROM PIZZA_SALES;
5. Average Pizzas Per Order
SELECT ROUND((SUM(QUANTITY) / COUNT(DISTINCT ORDER_ID)),2) AS AVG_PIZZA_PER_ORDER FROM pizza_sales;

6. Daily Trend for Total Orders **** SELECT dayname(ORDER_DATE) AS ORDER_DAY, COUNT(DISTINCT ORDER_ID) AS TOTAL_ORDERS FROM pizza_sales
GROUP BY ORDER_DAY;

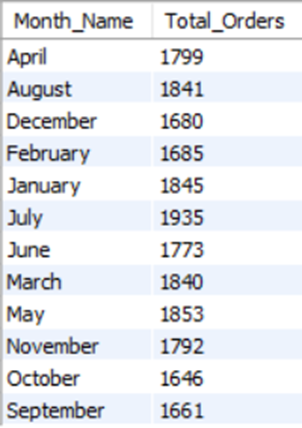
7. Monthly Trend for Orders
select monthname(order_date) as Month_Name, COUNT(DISTINCT order_id) as Total_Orders
from pizza_sales
GROUP BY Month_Name;
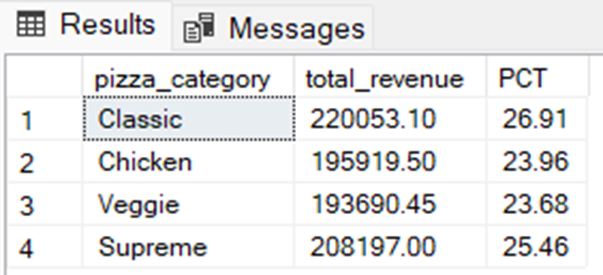
8. % of Sales by Pizza Category
SELECT pizza_category, ROUND(SUM(total_price),2) AS TOTAL_REVENUE, ROUND((SUM(total_price)*100) / (SELECT SUM(total_price) FROM pizza_sales),2) AS PCT FROM pizza_sales GROUP BY pizza_category ORDER BY PCT DESC;
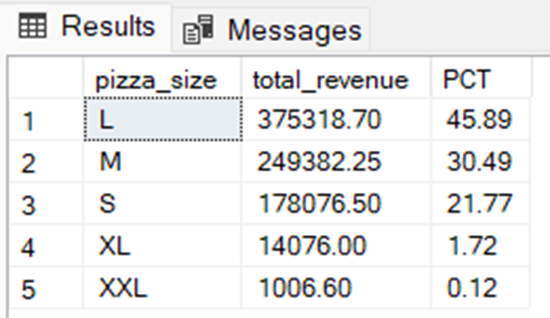
9. % of Sales by Pizza Size
SELECT pizza_size, ROUND(SUM(total_price),2) AS TOTAL_REVENUE, ROUND((SUM(total_price)*100) / (SELECT SUM(total_price) FROM pizza_sales),2) AS PCT FROM pizza_sales GROUP BY pizza_size ORDER BY pizza_size;
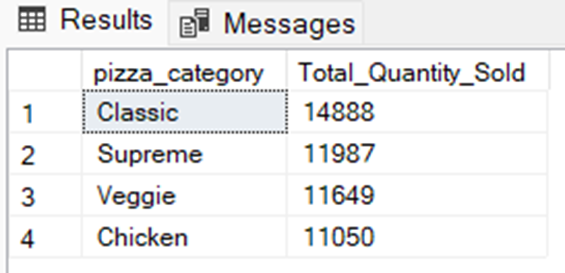
10. Total Pizzas Sold by Pizza Category
SELECT pizza_category, SUM(quantity) as Total_Quantity_Sold FROM pizza_sales GROUP BY pizza_category ORDER BY Total_Quantity_Sold DESC;
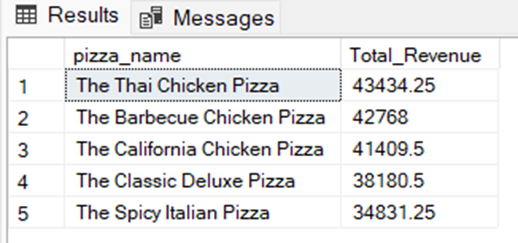
11. Top 5 Pizzas by Revenue
SELECT PIZZA_NAME, SUM(total_price) AS TOTAL_REVENUE FROM pizza_sales
GROUP BY pizza_name ORDER BY TOTAL_REVENUE desc LIMIT 5;
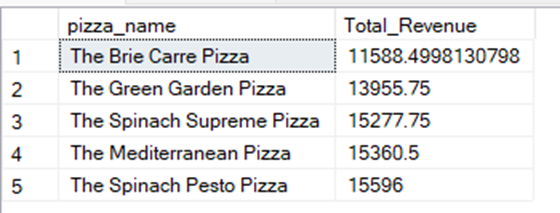
12. Bottom 5 Pizzas by Revenue
SELECT PIZZA_NAME, COUNT(DISTINCT order_id) AS TOTAL_ORDERS**** FROM pizza_sales**** GROUP BY pizza_name**** ORDER BY TOTAL_ORDERS**** LIMIT 5;
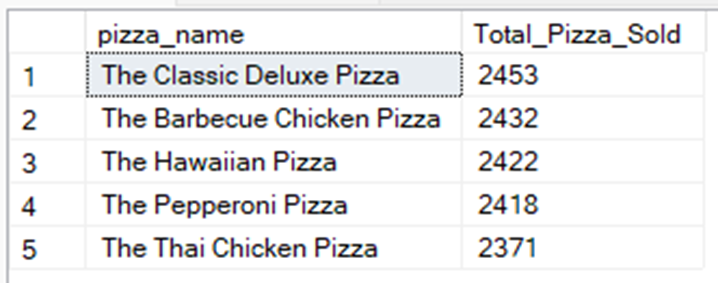
13. Top 5 Pizzas by Quantity
SELECT PIZZA_NAME, SUM(QUANTITY) AS TOTAL_QUANTITY FROM pizza_sales GROUP BY pizza_name ORDER BY TOTAL_QUANTITY desc LIMIT 5;
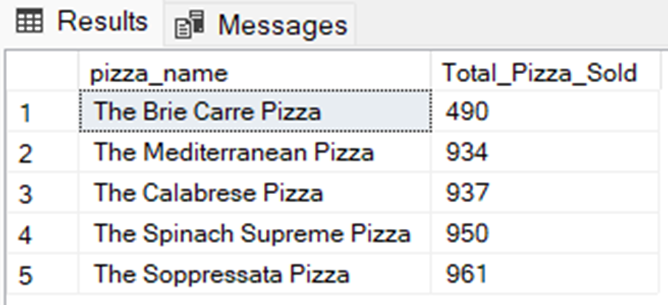
14. Bottom 5 Pizzas by Quantity
SELECT PIZZA_NAME, SUM(QUANTITY) AS TOTAL_QUANTITY FROM pizza_sales GROUP BY pizza_name ORDER BY TOTAL_QUANTITY LIMIT 5;
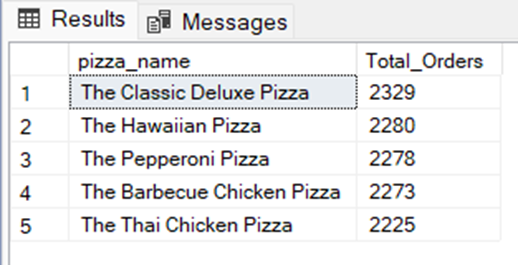
15. Top 5 Pizzas by Total Orders
SELECT PIZZA_NAME, COUNT(DISTINCT order_id) AS TOTAL_ORDERS FROM pizza_salesm GROUP BY pizza_name ORDER BY TOTAL_ORDERS desc LIMIT 5;
16. Bottom 5 Pizzas by Total Orders
SELECT PIZZA_NAME, COUNT(DISTINCT order_id) AS TOTAL_ORDERS FROM pizza_sales GROUP BY pizza_name ORDER BY TOTAL_ORDERS LIMIT 5;

Insights from the dashboard
Key Metrics
Total Revenue
- Amount: $817,860
- Insight: Utilizing SQL's capability to handle large datasets efficiently, we calculated a total revenue of $817.86k. This highlights the significant income generated from our pizza sales.
Average Order Value
- Amount: Calculated using SQL
- Insight: SQL was instrumental in determining the average value per order, providing a solid understanding of each order’s worth.
Total Pizzas Sold
- Amount: 49,574 pizzas
- Insight: SQL revealed that our customers devoured a staggering 49,574 pizzas, showcasing the high demand for our products.
Total Orders
- Amount: 21,350 orders
- Insight: Thanks to SQL’s organizational capabilities, we managed and processed a total of 21,350 orders seamlessly.
Average Pizzas Per Order
- Amount: 2.32 pizzas
- Insight: SQL's analytical prowess unveiled that, on average, 2.32 pizzas were sold per order. This is a key metric for understanding customer buying behavior.
Daily Total Orders Trend
- Insight: Using Power BI, we transformed raw data into a trend line, revealing that weekends, particularly Fridays and Saturdays, are prime times for pizza parties.
Monthly Total Orders Trend
- Insight: Power BI highlighted our peak sales months, showing that July and January are the champions for pizza orders. This seasonal insight is crucial for strategic planning.
Sales Percentage by Pizza Category
- Insight: Power BI’s visualizations made it clear that classic pizzas are the crowd favorites, dominating our sales categories.
Sales Percentage by Pizza Size
- Insight: Large pizzas took the spotlight, with Power BI effectively presenting the data in a visually appealing manner, indicating a strong preference for larger pizzas among our customers.
Additional project images


