Maven Sales Challenge - Computer Hardware Sales

About this project
Project Overview
Scope of Work
The objective of this project was to create an interactive dashboard tailored for sales managers, facilitating the tracking of their team's quarterly performance outside of their CRM system.
Approach
During initial review of the dataset, a preliminary plan and rough sketch were developed, laying out the framework for the project.
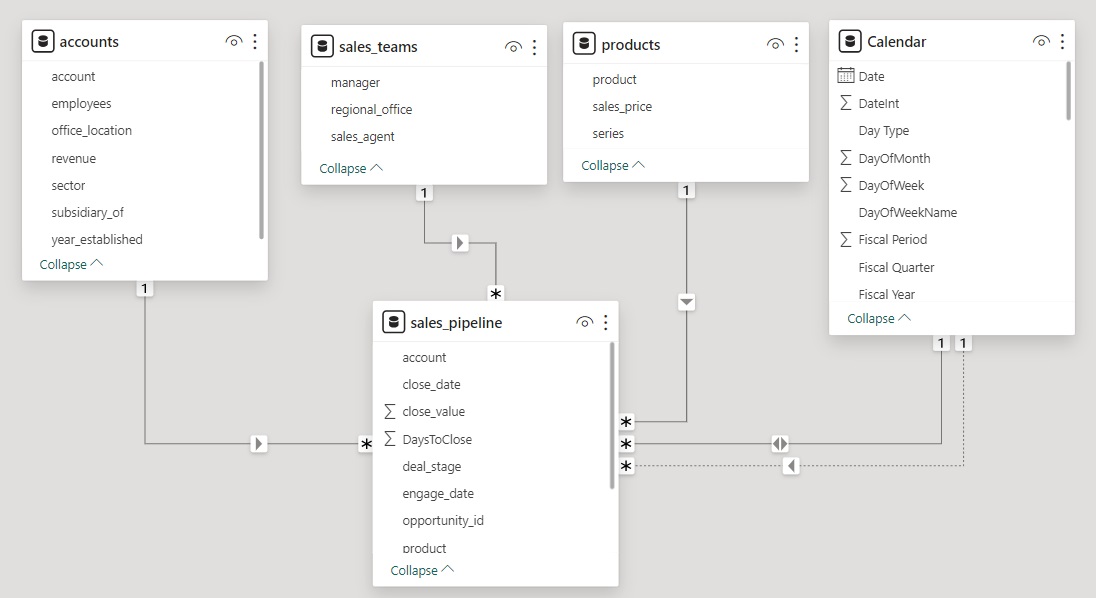
Upon closer examination of the data, it became evident that it was organized by regions, with each region having managers overseeing 5-6 sales agents. Thus, the overarching concept was to present a range of sales metrics, allowing for comparisons at the global, regional, and individual/team levels. This approach aimed to provide managers with a comprehensive understanding of their team's performance and facilitate benchmarking against various levels.
To achieve this, the dashboard was designed to display a matrix structure, showcasing the desired metrics and allowing managers to select themselves and specific quarters to view performance results, including quarter-over-quarter (QoQ) comparisons.
Furthermore, recognizing the importance of understanding product sales performance, additional features were incorporated to enable managers to identify trends within both product sales, sector, country and agent performance.
Data Handling and Modeling
Data cleaning was minimal, and the modeling process was straightforward. The primary focus was on establishing a connection between the Date and sales tables to synchronize engage and close dates, with the engage date serving as the primary reference point for metric calculations.
Metrics Analysis
Defining the appropriate metrics was crucial, tailored to the available dataset to ensure relevance and effectiveness. The following key metrics were identified:
- Wins: Tracking successful sales leads, providing insight into overall performance magnitude, particularly in Won deal in the Deal Stage analysis. Navigation tabs at the bottom visual is added to view performance by categories.

- Win Percentage: Calculating the success rate of closing deals, offering a more nuanced understanding of agent performance.
- Average Days to Close: Measuring the average duration between engagement and deal closure, indicating efficiency in deal management.
- Total Sales and Average Sales: Evaluating the total sales as well as the average value of successful sales, offering contextual insights into performance aggregated by Sales Agent, Product, Sector and Country by using the navigation buttons on the bottom visual.

- Quarter over Quarter Comparisons: Involves assessing changes, trends, or fluctuations in various aspects such as sales, or other key performance indicators from one quarter to the next. By examining quarter over quarter data, businesses can gain insights into their growth or decline patterns, identify areas of improvement, and make informed decisions to optimize their operations.
 By analyzing these metrics in conjunction, managers gain a comprehensive overview of their team's performance, enabling informed decision-making and strategic planning.
Additional project images


